Industrial IoT monitoring platform — Based in Chile

Geotechnical,
topographic
and structural
monitoring

Integrates sensors, geospatial data and critical alerts in a single platform. Field data converted into reliable operational decisions for mining, infrastructure and energy.

130+Active projects
470+Sensors online
15+Sensor types
24/7Continuous monitoring
The platform

All field data,
in one place

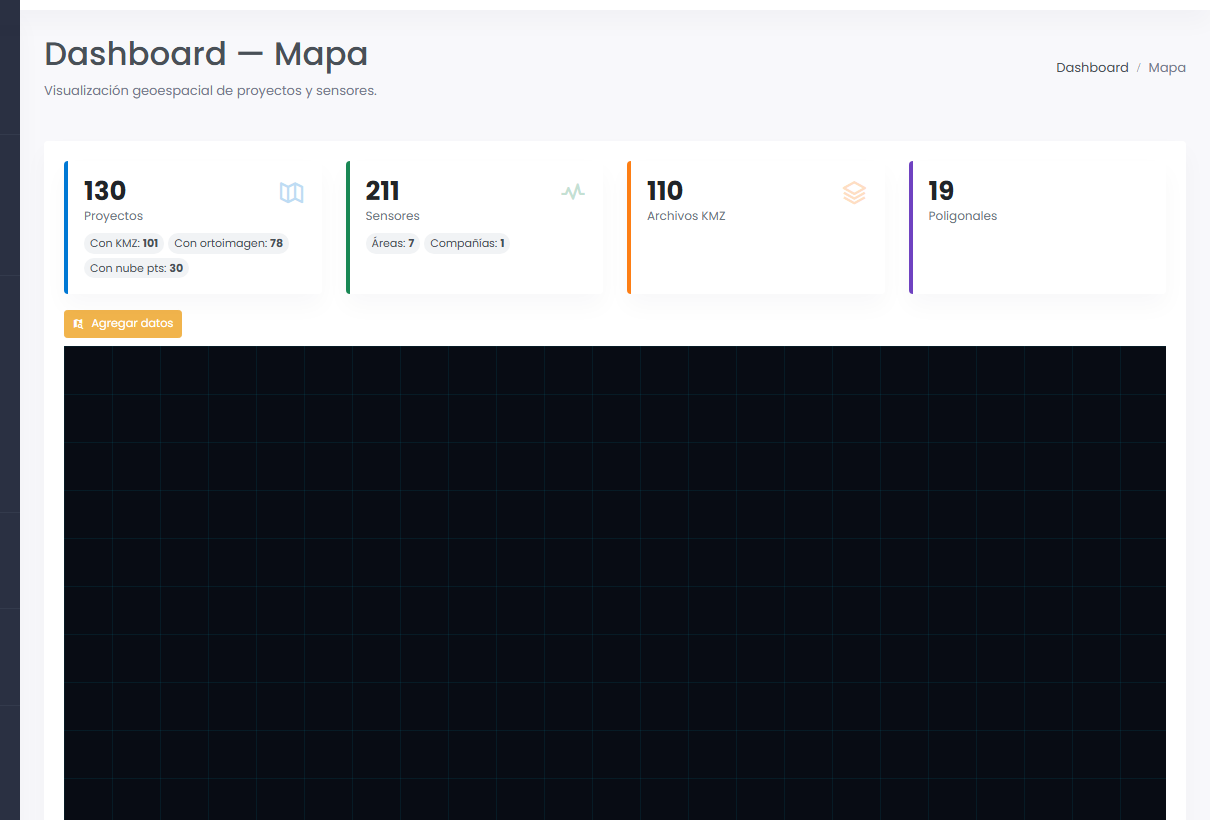
Espacio Métrico centralizes distributed sensors, LiDAR point clouds and field records in a single project topographic repository. Real-time GIS dashboard, online piezometry, configurable alerts and full topographic traceability.
  • GIS dashboard with geolocated sensors and threshold-based alerts
  • Online piezometry with automatic water table calculation
  • Online LiDAR point cloud viewer (.LAS/.LAZ) — no additional software required
  • Compatible with 15+ sensor types and leading industrial protocols
  • Topographic repository per project — surveys, flights and campaigns in one place
View full platform
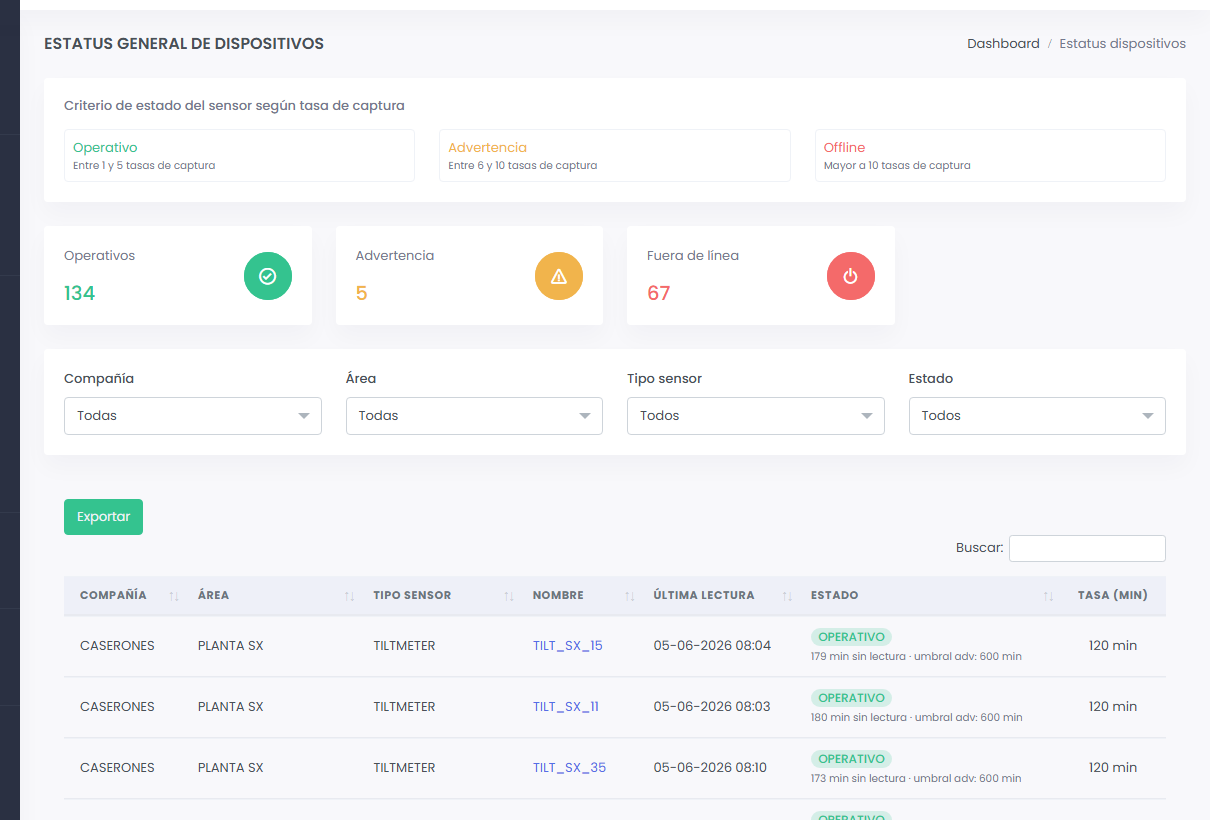
Sensor status panel

Status panel — 134 operating instruments

Industry solutions

Tailored to each project type

Modules

Integrated functionality

Each module works together. Sensor data feeds the charts, charts feed the reports, reports feed the decisions.

01
GIS Dashboard
Interactive map with geolocated sensors and multi-project view.
02
Online piezometry
Automatic water table calculation and threshold-based alerts.
03
Automatic alerts
Email or SMS notifications when defined thresholds are exceeded.
04
Point cloud viewer
Load and view .LAS/.LAZ files directly in the browser. Topographic repository with full project survey history.
Mining — Geotechnics

Continuous monitoring of a tailings storage facility

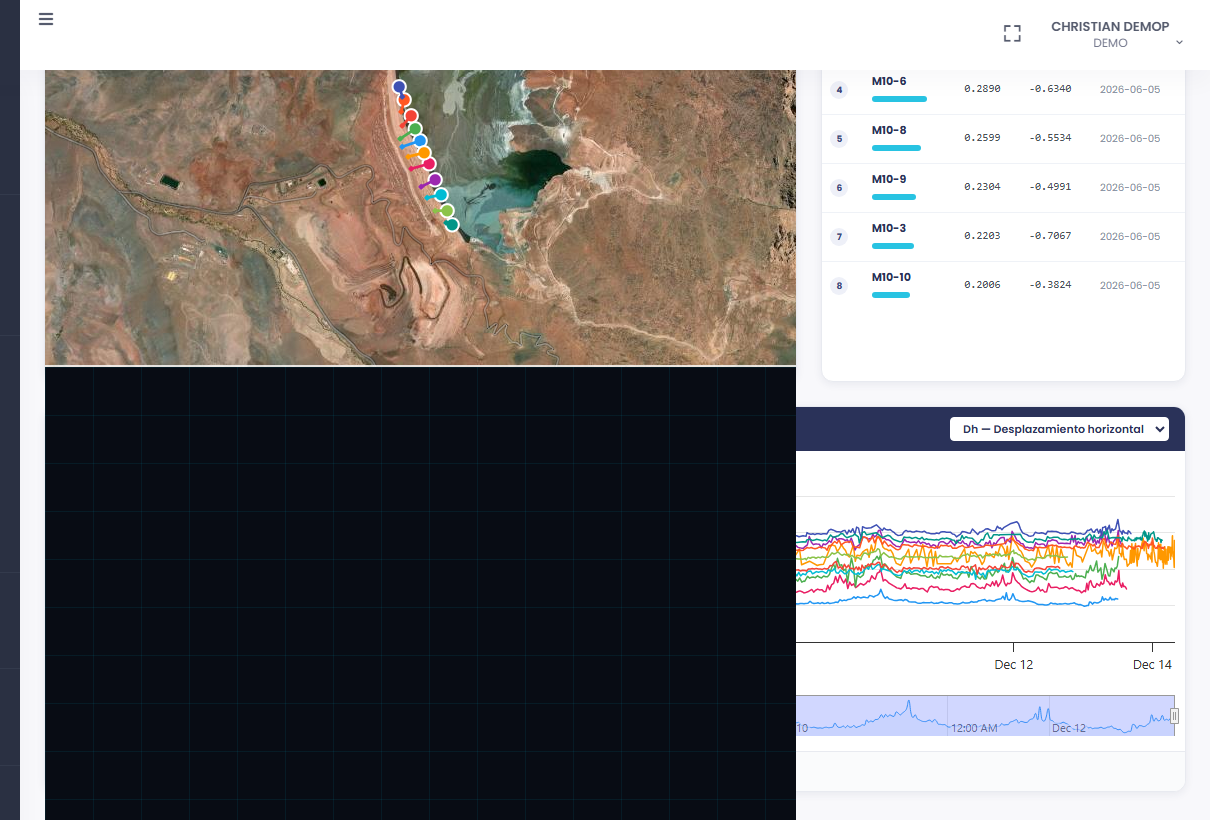
Integration of piezometric network, positional inclinometers and weather station in an active tailings deposit. The system sends automatic alerts to the geotechnical team when water table levels exceed the design threshold.
Critical event response time reduced from 4 hours to 15 minutes
18-month continuous history available for regulatory audit
View all case studies
Piezometric time series chart
Piezometric level time series — multiple instruments

Working on a monitoring project?

We walk you through the platform using real data from projects similar to yours. No commitment, no installation. The demo takes 30 minutes.