Espacio Métrico centralizes distributed sensors, LiDAR point clouds and field records in a web platform with no local installation. It is the project's topographic repository: all topographic information is organized, traceable and accessible from the browser.
Interactive map with all geolocated sensors. Configurable alerts by threshold, condition or variable combination. Simultaneous visualization of multiple projects with custom layers and filters by instrument type.
Interactive historical evolution charts per sensor. Online piezometry analysis with automatic water table calculation, isopiezometric curves and comparison between instruments over time.
Load and view point clouds (.LAS/.LAZ) directly in the browser, without specialized software. The platform acts as a centralized topographic repository: surveys, flights and campaigns are stored per project with full traceability.
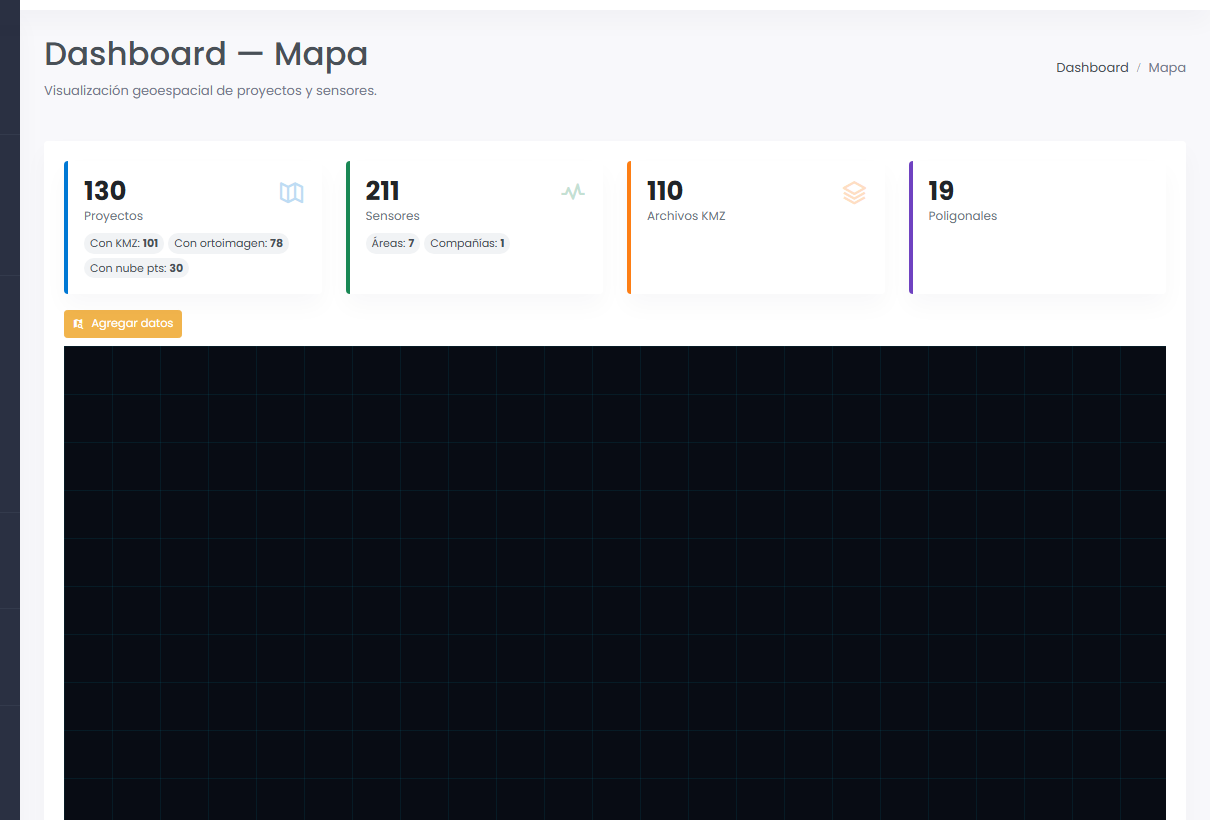
Each instrument has its GPS coordinate. A click gives access to its complete history.
Visual indicators of operational status, last reading and active alerts per instrument.
Consolidated view of all client projects or filtered by specific operation.
Compatible with leading manufacturers and protocols in the geotechnical market. No brand dependency or exclusive integrator.
We show the platform with real data from projects similar to yours, in a 30-minute session.